Math 1040
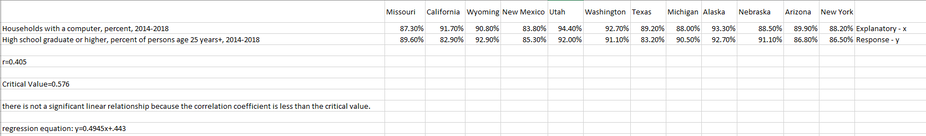
For this assignment students were tasked with analyzing bi-variate data of their choice, so long as the number of sets was between 6 and 12. Taking the data we needed to calculate the r-value, critical value, determine the linear correlation, and the regression equation. Afterward we could tell if there was or wasn't a significant linear relationship between the two sets of data that were used.
Reflection
Statistics is a mathematical discipline that is very easy to identify in the real world. Anything having to do with data, correlation, and numerical analysis of either quantitative or quantitative information falls under statistics. Mathematics in general is very useful, but not in very career field, while statistics is useful in almost every field in some way. Real world applications of math and statistics range from business, manufacturing, engineering, risk analysis, populations, correlation analysis and many other applications. For the above assignment, since it uses real world data, it is actually an example of a real-world application, another example from my work is using confidence levels to determine if manufactured medical devices are fit for use by using sample testing.
Problem solving skills are very important, and are only developed through practice and application. The above assignment forces problem solving skills by giving a vague start point, find the data of your choice and begin interpreting it. Starting with information you choose to analyze makes the results unique, therefore the process and answers are also unique. Statistics and mathematics in general give a logical step by step process to solving problems, in the case of above it was analyze the data, calculate the critical value and r-value, then compare the two to determine the linear correlation. Overall, while straightforward, it emphasizes the need for problem solving to be logical, even when looking at a problem that isn’t math based it still can be solved in a logical manner by starting with the information you have available and building your solution from there.
The above assignment demonstrates two key things, that statistics is very applicable in the real world, and that problem solving is very similar in regards to how you start. Despite how we may think, math is behind everything we see. Solving a problem, or answering a question, is always a logical process. Personally I find math to be the best teacher, and practice, for understanding, and working with, the world around all of us.
